Description
A report that uses various health indicators to measure the performance and operational efficiency of the revenue cycle management and to help identify areas of improvement for the Practice’s revenue cycle operations. In the report, users will have access to key billing metrics such as the First Pass Resolution Rate, A/R days, Gross and Net Collections rate, Charge and Payment lags, and other metrics to see where they stand in comparison with the 6-month average.
Significance
1. This report presents a trend analysis based on historical data from the past six months.
2. Tooltips for all parameters in KPI Report display the formulae used for calculation. Users can click on the question mark symbol to view the formula.
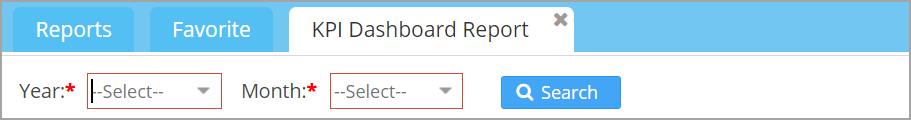
Search Filters of H13 Report
| Field | Description |
| Year | Select a year from the drop-down Note: The most recent year displayed in the drop-down will be the calendar year of the last closed month. |
| Month | Select a month from the drop-down The most recent month in the drop-down will be the last closed month. |
Search Screen of H13 Report
Sample H13 Report
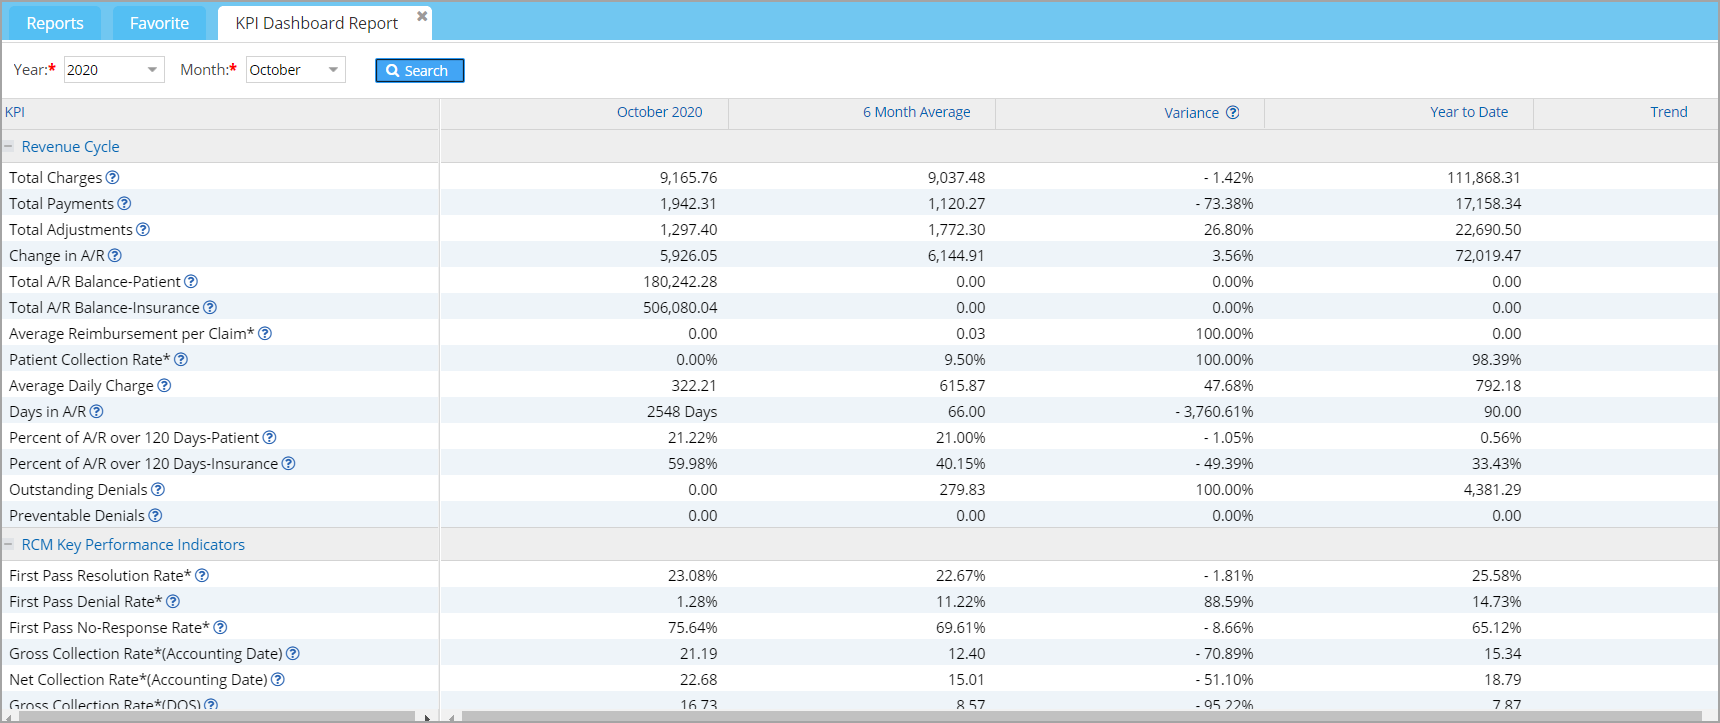 Image 1
Table 1 explains each row in detail. Assumes search criteria as Sept 2019 for reviewing the table.
| Column Name | Date Reported | Month wise | 6 Month Average | Year To Date | Variance |
| Practice Operations | |||||
| Appointment Count | Appt. Date | Count of appointments for all schedule status with the exception of “Void” and “Missed” for the month. In the sample report, for the period between 9/1/2019 and 9/30/2019. | Average calculated for the 6 month period. “Void” and “Missed” status are excluded from the calculation. In the sample data, the reporting period is between 4/1/2019 and 9/30/2019. | Count of appointments for all schedule status with the exception of “Void” and “Missed” for the year. Reporting period here is between 1/1/2019 and 9/30/2019. | ((6 month average-month wise)/6 month average)*100 |
| Appointment Cancellation Rate | Appt. Date | (Count of ‘cancelled’ appointments/ total count of appointments for the month)* 100 In the sample, between 9/1/2019 and 9/30/2019 | (Count of ‘cancelled’ appointments of previous 6 months /total count of appointments of prev. 6 months )*100 The sample considers 4/1/2019 to 9/30/2019 | (Count of ‘cancelled’ appointments of year-to-date(YTD)/ total count of appointments YTD)*100 The sample considers dates between 1/1/2019 and 09/30/2019 | |
| Appointment No Show rate | Appt. Date | (Count of ‘cancelled’ appointments by clinic or provider/ total count of appointments for the month )*100 The given sample takes 9/1/2019 to 09/30/2019 | (Count of ‘cancelled’ appointments by clinic or provider of prev. 6 months / total count of appointments of prev. 6 months) *100 The sample takes in dates between 4/1/2019 and 09/30/2019. | (Count of ‘cancelled’ appointments by clinic or provider YTD / total count of appointments YTD) *100 The sample takes in dates between 1/1/2019 and 09/30/2019 | |
| Eligibility Verification Rate | Appt Date | (Count of appointment schedules for which eligibility has been checked / total count of valid appointments for the month) *100 Period in the above sample: 9/1/2019 to 9/30/2019 | (Count of appointment schedules of the prev. 6 months for which eligibility has been checked / total count of valid appointments of the prev. 6 months) *100 Period in the above sample: 4/1/2019 to 9/30/2019 | (Count of appointment schedules YTD for which eligibility has been checked / total count of valid appointments YTD) *100 Period in the above sample: 1/1/2019 to 9/30/2019 | |
| Unbilled Insurance Charges | Accounting Date | Total of all charges of the month with line status ‘New’ . Date period in the above example: 9/1/2019 to 9/30/2019 | (Total of all charges with line_status ‘New’ in the prev. 6 months )/ 6 Date period in the above example: 4/1/2019 to 9/30/2019 | Total of all charges of YTD with line status ‘New’ . Date period in the above example: 1/1/2019 to 9/30/2019 | |
| Charge Entry Lag | Date of Service | (Total count of days between DOS and charge entry date) / total lines for the month. DOS considered between 9/1/2019 and 9/30/2019 in the above sample | (Total count of days between DOS and charge entry date) / total lines in the prev. 6 months DOS considered between 4/1/2019 and 9/30/2019 in the above sample | (Total count of days between DOS and charge entry date) / total lines for YTD. DOS considered between 1/1/2019 and 9/30/2019 in the above sample | |
| Charge Submission Lag | Date of Service | (Total count of days between DOS and first claim date) / total lines for the month DOS considered between 9/1/2019 and 9/30/2019 in the above sample | (Total count of days between DOS and first claim date) / total lines in the prev. 6 months DOS considered between 4/1/2019 and 9/30/2019 in the above sample | (Total count of days between DOS and first claim date) / total lines for YTD DOS considered between 1/1/2019 and 9/30/2019 in the above sample | |
| Payment Lag | Date of Service | (Total count of days between DOS and first payment date) / total lines for the month DOS considered between 9/1/2019 and 9/30/2019 in the above sample | (Total count of days between DOS and first payment date) / total lines for the prev. 6 months DOS considered here: 4/1/2019 – 9/30/2019 | (Total count of days between DOS and first payment date) / total lines for YTD DOS considered between 1/1/2019 and 9/30/2019 in the above sample | |
| Patient Visits | Acct. Date | Distinct case encounters for the month Date considered: 9/1/2019 -9/30/2019 | Distinct case encounters / total lines for the prev. 6 months Date considered: 4/1/2019 – 9/30/2019 | Distinct case encounters / total lines for the YTD Date considered: 1/1/2019 – 9/30/2019 | |
| Unbilled Visits Without Charges | Acct. Date | Count of case encounters of the month of new lines +count of appointments posted for the month with superbill status ‘NEW’ Date considered here: 9/1/2019 -9/30/2019 | (Count of case encounters of prev. 6 months of new lines + count of appointments posted during the prev. 6 months with superbill status ‘NEW’ ) / 6 Date considered here: 4/1/2019 – 9/30/2019 | – | |
| RCM Key Performance Indicators | |||||
| First Pass resolution Rate* (5 month look back) | Claim Date |
[(Total Number of lines resolved ( paid + deductible) on the first submission) ÷ Total Number of
lines resolved during same period)]*100
|
Find the total of the First Pass resolutions for the previous 6 months (April-Sept) and divide by 6 |
[( Total Number of lines resolved ( paid + deductible) on the first submission) ÷ Total Number of
lines resolved during same period of time)]*100
|
|
| First Pass Denial Rate* (5 month look back) | Claim Date | (Denied procedure count / submitted procedure count)*100. In the sample, for denied procedure count, consider claims between 5/1/2019 – 7/31/2019 and those Denied on first submission till 09/30/2019. Submitted procedure count is count of encounter lines where lowest claim in between 5/1/2019 – 7/31/2019 | Find the total of the First Pass Denial rate for the previous 6 months(April-Sept) and divide by 6 | (Denied procedure count / submitted procedure count)*100. In the sample, for denied procedure count, consider claims between 9/1/2018 – 11/30/2018 and those Denied on first submission till 09/30/2019 . Submitted procedure count is count of encounter lines where lowest claim in between 9/1/2018 – 11/30/2018 | |
| First Pass No-Response Rate* (5 month look back) | Claim Date | (No response procedure count / submitted procedure count)*100. In the sample, for No response procedure count, consider Count of claims b/w 5/1/2019 – 7/31/2019 where on first submission, payment is not processed within the date limit. Submitted procedure count is count of encounter lines where lowest claim in between 5/1/2019 – 7/31/2019 | Find the total of the First Pass No-Response rate for the previous 6 months(April-Sept) and divide by 6 | (No response procedure count / submitted procedure count)*100. In the sample, For No response procedure count, consider Count of claims b/w 9/1/2018 – 11/30/2018 where on first submission, payment is not processed within the date limit. Submitted procedure count is count of encounter lines where lowest claim in between 9/1/2018 – 11/30/2018 | |
| Gross Collection Rate* | Acc. Date | (Total Payment/total_charge)*100. In the sample, total Payments and Total Charges are for the month of September. | Find the gross collection rate for the previous 6 months (April-Sept) and divide by 6. Express as percentage. | (Total Payment/total_charge)*100. In the sample, total Payments and Total Charges are for the period of Jan to September. | |
| Net Collection Rate* | Acc. Date | [Total payment/(total charges-Ins. adjustments)]*100. | Find the net collection rate for the previous 6 months and divide by 6. Express as percentage. | [Total payment/(total charges-Ins. adjustments)]*100. | |
| Revenue Cycle | |||||
| Total Charges | Acct Date | Total charges for the month Date reported here: 9/1/2019 – 9/30/2019 | (Total charges for the prev. 6 months) / 6 Date reported here: 4/1/2019 – 9/30/2019 | Total charges for YTD Date reported here: 1/1/2019 to 09/30/2019 | ((6 month average-month wise)/6 month average)*100 |
| Total Payments | Acct Date | Total Payments for the month Date reported here: 9/1/2019 – 9/30/2019 | (Total payments for the prev. 6 months) / 6 Date reported here: 4/1/2019 – 9/30/2019 | Total Payments for YTD Date reported here: 1/1/2019 – 9/30/2019 | |
| Total Adjustments | Acct Date | Total Adjustments for the month Date reported here: 9/1/2019 – 9/30/2019 | (Total Adjustments for the prev. 6 months) / 6 Date reported here: 4/1/2019 – 9/30/2019 | Total Adjustments for YTD Date reported here: 1/1/2019 – 9/30/2019 | |
| Change in A/R | Acct Date | (Total bill amt-Total payment-total adjustments ) for the month Date reported here: 9/1/2019 – 9/30/2019 | (Total bill amt-Total payments-total adjustments for the prev. 6 months)/6. Date reported here: 4/1/2019 – 9/30/2019 | ||
| Total Deposit | Acc. Date | Total Deposits for the month | (Total deposits for the prev. 6 months) / 6 | Total Deposits for YTD | |
| Change in A/R Based on Total Deposit | Acc. Date | Total deposit-total payment-total adjustment for the month | (Total deposit-total payment-total adjustment for the prev. 6 months)/6 | Total deposit-total payment-total adjustment for YTD | |
| Total A/R Balance-Patient | Acct Date | Total remaining amount in lines posted till date with line_status in (‘BILL_TO_PT’,’BILL_TO_GR’,’IN_COLLECTION’) | |||
| Total A/R Balance-Insurance | Acct Date | Total remaining amount in all open lines posted till date if aging based on DOS. OR Total remaining amount in all claim- generated open lines posted till date if aging based on Claim Date | |||
| Average Reimbursement per Claim* (90 day look back) | Claim Date | Total Paid amount / Total Encounters. The total paid amount is the total of all payments up to the current date for encounters with dos 90 days behind for a period of 1 month | Find the total of Avg. reimbursement for the previous 6 months and divide by 6 | Total Paid amount / Total Encounters The total paid amount is the total of all payments up to the current date for encounters with dos 90 days behind from year start for a period of 1 month | |
| Patient Collection Rate* (5 month look back) | Acct Date | Total patient paid amount /Total balance of patient responsibility. Total patient Paid amount is (patient paid-patient take back) amount up to the current month for encounter lines with line status in (‘PAID_CLOSE’,’WO_CLOSE’), posted 5 months back up to a period of 3 months. Total balance is charges before applying of encounter lines in the above period with line status in(‘PAID_CLOSE’,’WO_CLOSE’) Claim Date considered here: 5/1/2019 – 7/31/2019 | Find the total of Patient Collection Rate for the previous 6 months (April-Sept) and divide by 6 | Total paid amount/Total balance of patient responsibility. Total paid amount is (paid-take back) amount up to 9/30/2019 of encounter lines posted between 9/1/2018 and 11/30/2018 with line status in(‘PAID_CLOSE’,’WO_CLOSE’). Total balance is charges before applying of encounter lines posted between 9/1/2018 and 11/30/2018 with line status in(‘PAID_CLOSE’,’WO_CLOSE’). | |
| Days in A/R | Acct Date |
(Total charge for the DOS period -total payments for the DOS-total adjustments for the DOS)÷(Total charge for the DOS
period/No of days)
DOS period: From the start till the end of the selected month
|
(Total charge for the 6-month period -total payments for the 6-month period-total adjustments for the 6-month period)÷(Total charge for the 6-month period/No of days) | Total charge for YTD -total payments for YTD-total adjustments for YTD )÷(Total charge for the YTD /No of days) | |
| Percent of A/R over 120 days-Patient | DOS | Percent of [(Net receivable over 120 days / Current AR)] Net receivable over 120 days is Remaining amount in the encounter lines with DOS 120 days before the input date with line_status in (‘BILL_TO_PT’, ‘BILL_TO_GR’). Current A/R is Total Balance of encounter lines up to the input month. For Net receivable, sample considers encounter lines posted on or before 6/2/2019. For Current A/R. sample considers encounters up to 9/30/2019 | Find the Percent of A/R over 120 days(Pat.) for the previous 6 months(April-Sept), total them and divide by 6. | (Net receivable over 120 days / Current AR) * 100 Net receivable over 120 days is Remaining amount in the encounter lines from January 1st to September with DOS 120 days before the current date with line_status in (‘BILL_TO_PT’, ‘BILL_TO_GR’). Current A/R is Total Balance of encounter lines up to the input month. | |
| Percent of A/R over 120 days-Insurance | DOS/Claim Date | Percent of [(Net receivable over 120 days) / Current AR]. If aging based on DOS, Net receivable over 120 days is the Remaining amount in all open lines with DOS on or 120 days before the specified date. If aging based on claim date, Net receivable over 120 days is the Remaining amount in all open lines for which claims are generated on or before 120 days before the specified date. Date reported in the above sample: 6/2/2019. | Find the Percent of A/R over 120 days(Ins) for the previous 6 months(April-Sept), total them and divide by 6. | Percent of [(Net receivable over 120 days) / Current AR]. If aging based on DOS, Net receivable over 120 days is the Remaining amount in lines from January 1st to September with DOS 120 days before the input date. If aging based on claim date, Net receivable over 120 days is the Remaining amount in lines from January to September with claim date 120 days before the specified date. | |
| Outstanding Denials | Acct Date | Balance of those payments posted in the month where the latest payment of encounter line is denied Date considered: 9/1/2019-9/30/2019 | (Balance of those payments posted in the previous 6 months where the latest payment of encounter line is denied) / 6 Date considered: 4/1/2019-9/30/2019 | Balance of those payments posted YTD where the latest payment of encounter line is denied Date considered: 1/1/2019-9/30/2019 | |
| Preventable Denials | Acct Date | Balance of those payments posted in the month where the latest payment of encounter line is denied under denial category of Authorization,Coding and coverage Date considered: 9/1/2019-9/30/2019 | (Balance of those payments posted in the previous 6 months where the latest payment of encounter line is denied under denial category of Authorization,Coding and coverage) / 6 Date considered: 4/1/2019-9/30/2019 | Balance of those payments posted YTD where the latest payment of encounter line is denied under denial category of Authorization,Coding and coverage Date considered: 1/1/2019-9/30/2019 | |